Where the Cold Was Deepest Was Not Where the Health Risk Rose Most

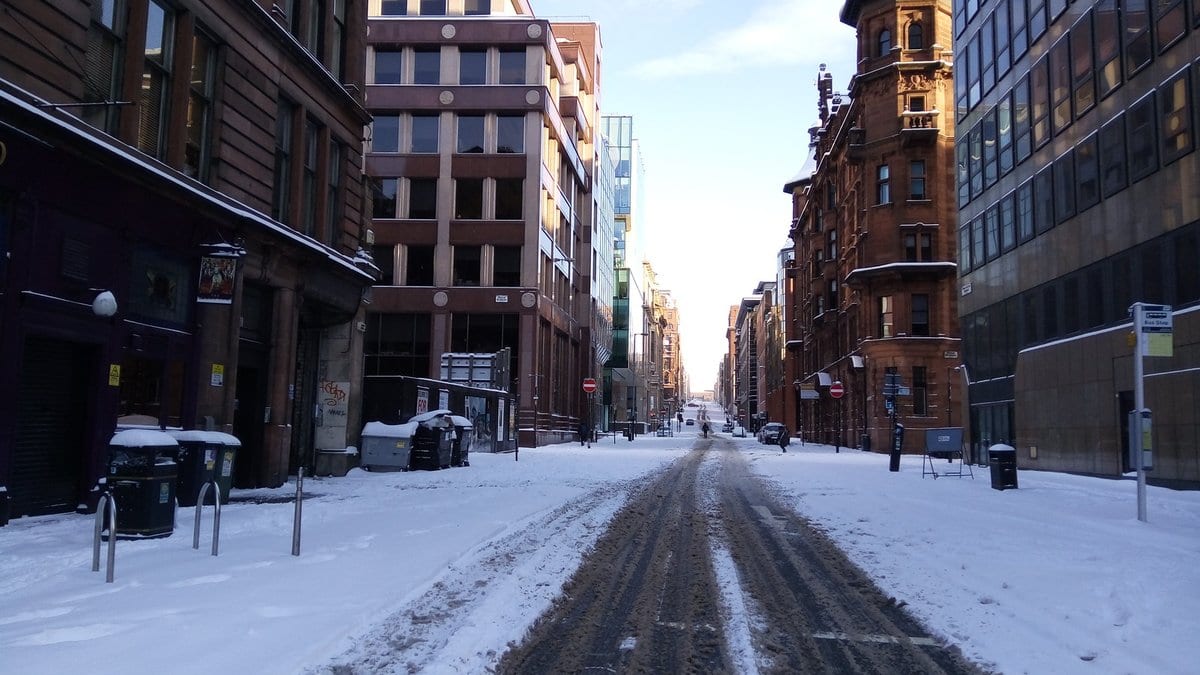
On Feb. 12, 2018, the ring of winds that circles the Arctic in the stratosphere broke down and the air high over the pole warmed abruptly. Events like that one are known as sudden stratospheric warmings. They happen far above the weather, but the circulation anomaly works its way down, nudging North Atlantic wind patterns into the phase that lets cold air spill south and east. Two weeks later Britain was under snow and calling it the Beast from the East, and the cold held across northern Europe for roughly six weeks.
Attributing any of it to the stratosphere is harder than it sounds: the winter would have made weather of its own anyway. A study published Nov. 11, 2026, in Natural Hazards and Earth System Sciences answers the question by running the winter twice. Philip Rupp, of the Meteorological Institute Munich at Ludwig Maximilian University, led the work with colleagues at the Norwegian Institute of Public Health and the University of Exeter. The two worlds come from SNAPSI, a coordinated modeling project. Five forecasting systems were each restarted from before the warming began and run twice: once with the stratosphere held to what was observed, so the warming happens, and once held to the long-term average, so it does not.
Each run gives a daily temperature for a region, which is fed through an exposure-response curve: a map from a day's temperature onto the deaths expected over the following three weeks. The curves are fitted region by region from decades of local death records. The difference between the two worlds is what the warming explains.
That difference is a modeled quantity, and the authors are explicit about it. The estimates, they write, represent "conditional, model-based expectations of mortality impacts given the presence of an SSW, rather than direct attribution of observed deaths." Nobody counted bodies here; a model was run twice. The link between these warmings and higher winter mortality was established years ago, and the epidemiology here is deliberately ordinary. What is new is the meteorological half: a control ensemble with no warming in it, which isolates one named event.
The same cold does not carry the same risk everywhere
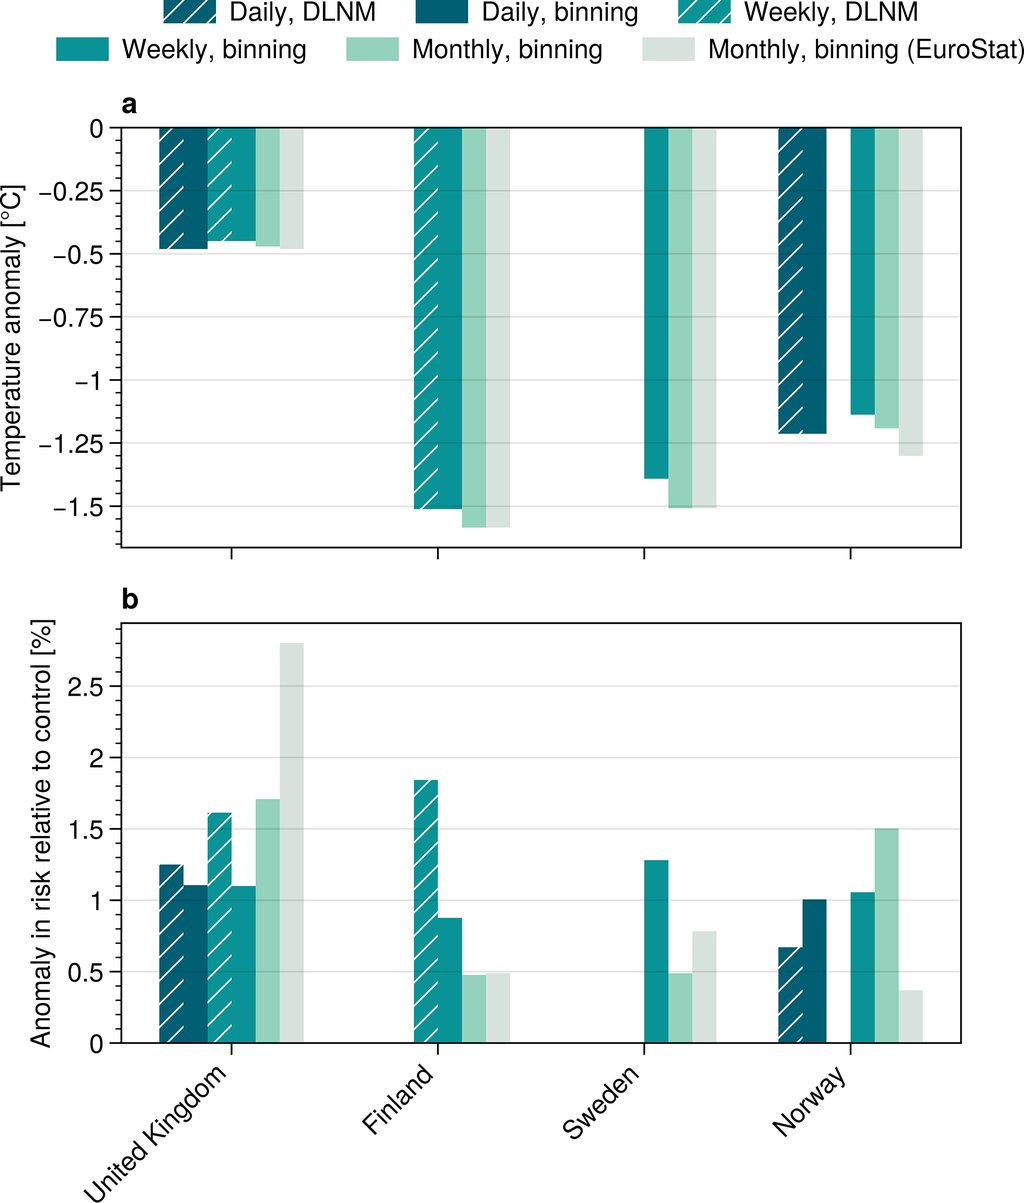
Averaged over the month after onset, the paper reports robustly weak temperature anomalies of about −0.5 °C for the UK, against anomalies past −1 °C throughout the Nordics. The risk runs the other way. The authors put the UK's attributable increase in mortality risk at "at least as strong (if not stronger)" than the Nordic countries', whose estimates they call "of comparable magnitude" and more variable between methods. A warning travels with that: the spread between forecasting systems is substantial, so "the ordering between individual countries should not be over-interpreted."
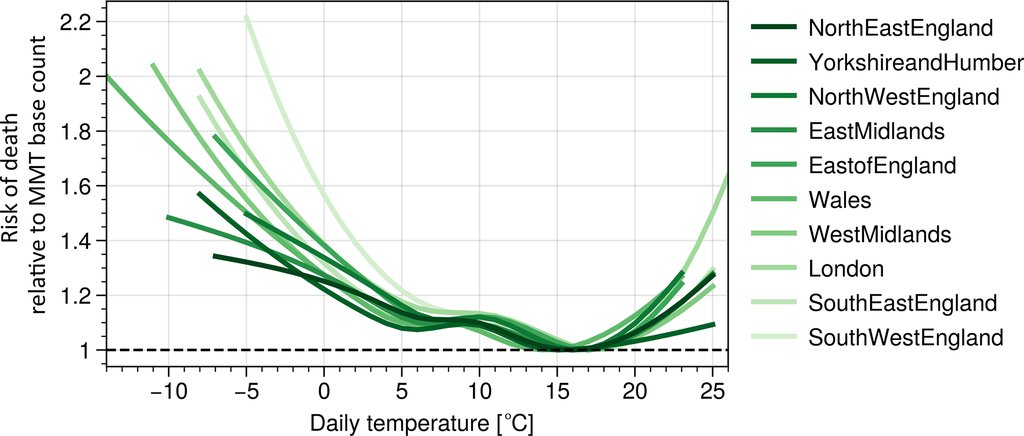
What separates the two is how steeply each region's curve climbs as the temperature falls. The Nordic curves are comparatively flat. At the coldest temperatures in their records, the modeled daily risk of dying rises by about 20% in Norway and about 40% in Sweden and Finland, against each country's own lowest-risk temperature. Across individual UK regions the same comparison gives 40 to 120%. A small drop on a steep curve can move mortality as much as a large drop on a flat one.
Why the UK curves are steep is the part the paper reads rather than measures. The authors take the steepness as "likely reflecting lower population-level adaptation to cold weather." They add that demographic or socioeconomic factors may also play a role, from baseline health to heating practices, though pinning that down is beyond the dataset they have. The pattern itself is not new. The paper traces it to The Eurowinter Group, which measured across Europe in 1997 that countries with milder climates are usually more vulnerable to cold spells.
What the numbers are, and what they are not
The absolute counts come last, and they come wide. For England and Wales, the best estimate is an expected excess of about 750 deaths attributable to the warming, with a range of roughly 400 to 800 across the five forecasting systems. For Finland, Sweden and Norway combined, the best estimate is about 300 expected deaths, ranging from roughly 100 to 500. Those ranges cover the spread between forecasting systems alone, not the structural uncertainty of choosing one exposure-response model over another. The two counts are not a ranking: the populations differ greatly in size, and the ranges overlap. The authors' verdict on all of them is that "the absolute numbers reported here should be read as rough estimates rather than as precise counts."
The error does not run in only one direction. The model runs stop at the end of March, and the signals had not clearly ended with them, so the authors offer their figure as a possible lower bound. For scale, that is an increase of about 1% on the average winter death count for England and Wales over that stretch. It also sits close to an independent check. A University of Reading team analyzed UK mortality after past warmings, in Atmospheric Science Letters in October 2020, and found a mean impact of about 620 excess deaths per event, from observed death records rather than nudged model runs.
Inside the UK, the pattern does not repeat
The southern-steepness story explains the UK against the Nordics. It does not explain the UK against itself. On the daily estimates, the attributable increase in risk across English and Welsh regions runs from about 0.7% in South East England to about 1.6% in North West England, and the paper is blunt about the pattern: "no clear north-south gradient is apparent." The curves really are steeper in the south, yet the largest attributable risk sits in the north west. The authors' explanation is that southern steepness is offset by the weaker cold those regions saw. Hazard magnitude and population vulnerability both belong in the calculation, and they do not line up.
The least dramatic result may be the most portable. Mortality records in many countries are weekly or monthly, which normally rules them out of work like this. Here the weekly estimates stayed close to the daily ones in most regions. Monthly data is where it frays: in Yorkshire and Humber, monthly inputs overshot the attributable impact by up to about a factor of two, and the authors treat monthly figures as giving a signal's sign and rough size rather than a quantitative attribution. A sudden warming is also visible in forecasts before its cold arrives, and the cold it brings lasts weeks rather than days. Knowing which populations sit on the steep part of the curve is something a health service could use in advance.