A Rip Current Forecast That Catches Almost Every Incident, and Warns Almost Every Day

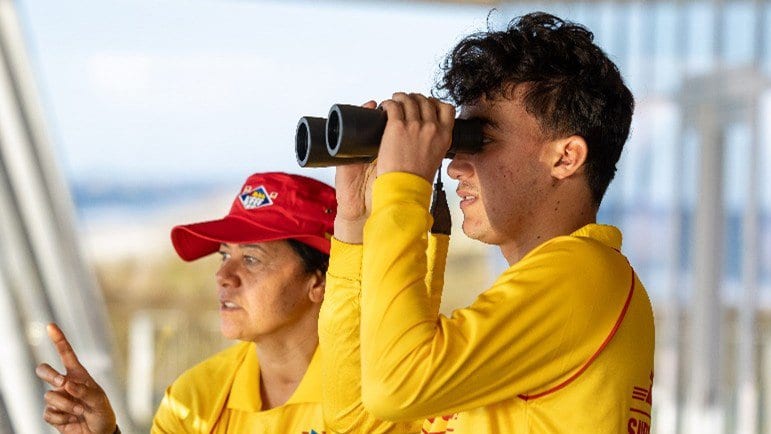
Every rescue on a New Zealand surf beach ends in paperwork: the time, the place, how many people were pulled out, and the lifeguard's reading of what went wrong. Between December 2001 and November 2022, Surf Life Saving New Zealand filed tens of thousands of those reports, and rip currents were blamed for 53 percent of all the rescues in them. A team led by Christopher Stokes of the Met Office in Exeter, with Juliana Albertoni de Miranda of Surf Life Saving New Zealand and colleagues at the University of Plymouth, has turned that archive into a national forecast of rip danger.
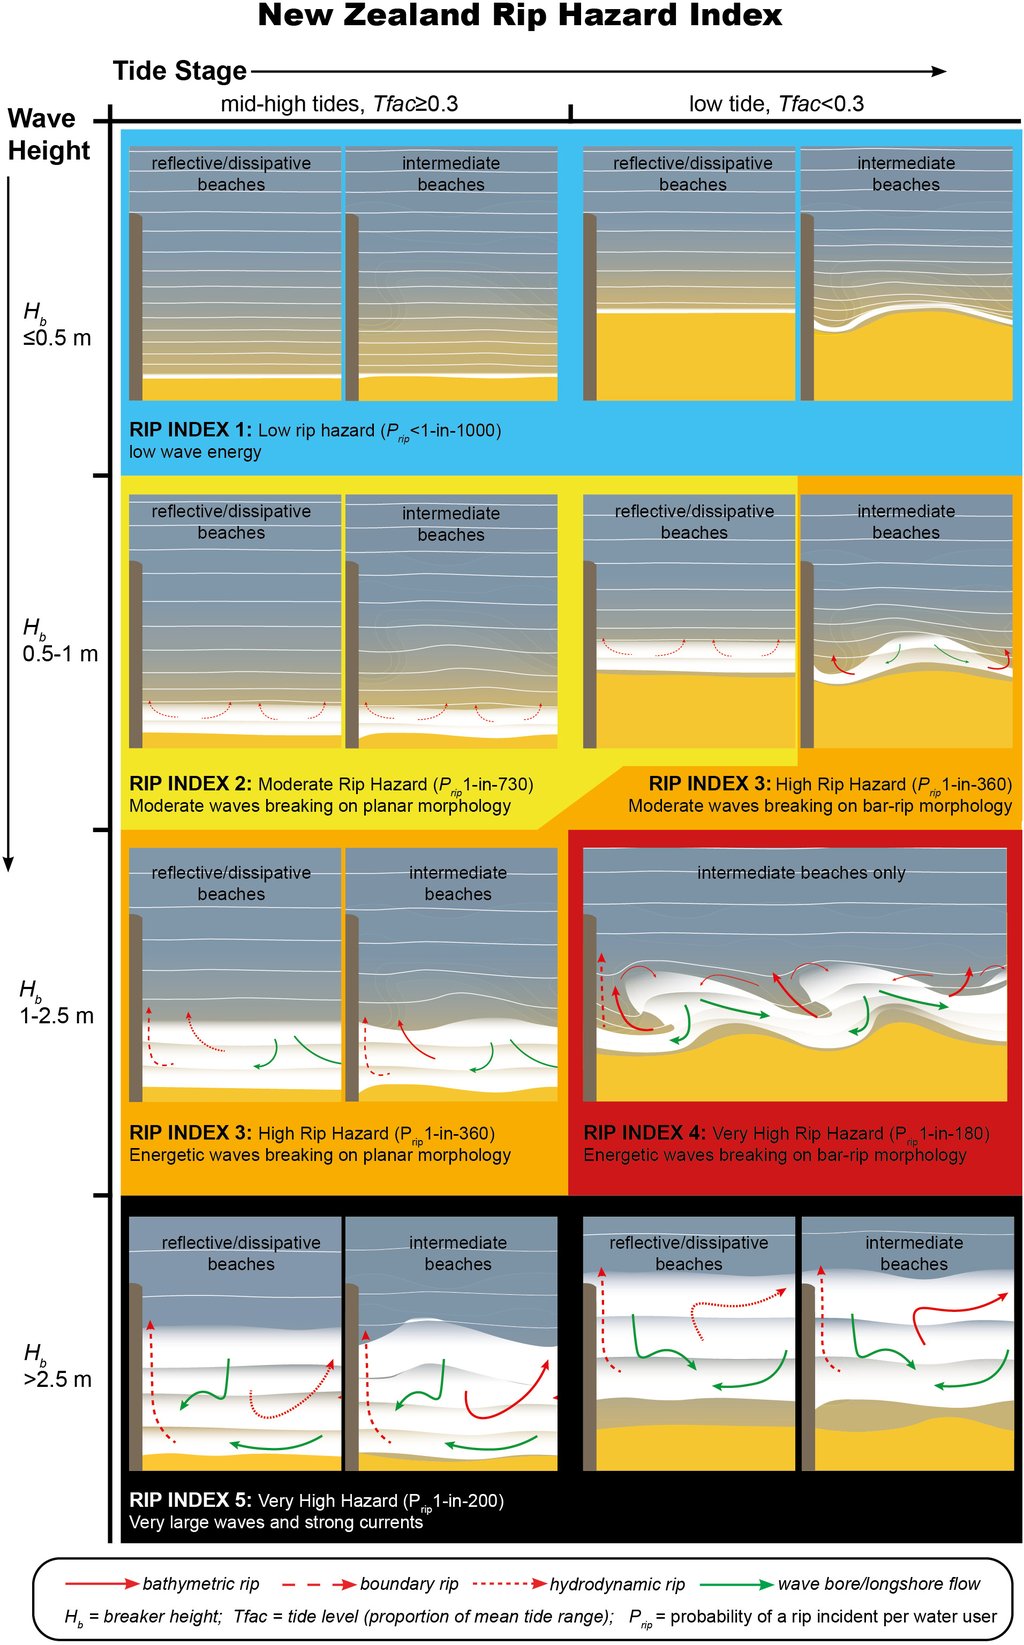
The algorithm behind it is almost aggressively simple. It reads three things: the height of the breaking waves, how low the tide is against that beach's own average low water, and whether the beach carries sandbars with channels between them. That last is the shape that spins up textbook rip currents. Out comes a Rip Index from one to five, with no statistics underneath it, only thresholds. Waves above roughly 1 meter on a sandbar beach at or below its average low tide set the index at four, the level the authors treat as the dangerous one. The work was published Nov. 16, 2026, in Natural Hazards and Earth System Sciences.
What a hit rate is a rate of
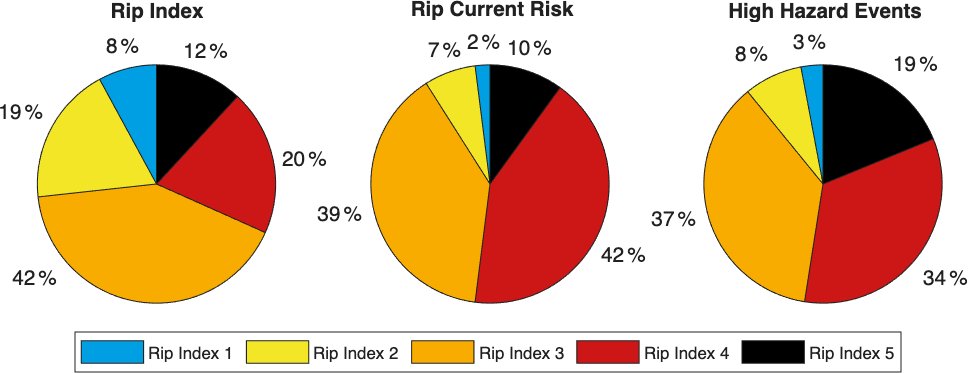
Run back over the archive, the forecast would have flagged 98 percent of the rip incidents in it. That is the number the paper's abstract leads with, as "a high incident hit rate", and it is worth knowing what it counts. It is recall, what forecasters once called the probability of detection: the share of real incidents that fell at a time the system was already warning. It says nothing at all about the times it warned when nothing happened. The results section says so immediately: "This recall rate was achieved by issuing rip warnings (RI 2–5) 92 % of the time".
A system that warns nine days in ten will catch almost everything by construction, and the authors measure that too. Their efficiency metric divides the share of incidents captured by the share of time warnings are out. Across every warning above the lowest level it comes to 1.06, barely better than warning blindly. The skill is further up the scale: above level three the efficiency reaches 1.63, and the fourth level on its own "was predicted 20 % of the time but captured 42 % of all SLSNZ rip incidents". That is the more honest version of the claim that it works.
How often the index cries wolf is not in the paper, and not for want of looking. "It was not possible to examine the rate of false positives because bathing hazard can be high without an incident occurring, for example if no one enters the water or due to lifeguard preventative actions," the authors write. A rip can run hard on an empty beach, or while a lifeguard is moving the flags to keep swimmers off it. Neither leaves a record to score the forecast against.
The five levels do earn their keep in how much danger each implies. Because lifeguards also counted heads in the water, the team could divide incidents by bathers and get a per-person hazard. It climbs steeply: about 1 rescue for every 1,200 people in the water at the lowest level, and about 1 in 200 at the top of the scale. Then it stops climbing. At sandbar beaches the fifth level came out marginally below the fourth, and the authors claim only that the biggest waves "do not necessarily lead to higher hazard levels than moderate waves acting on low tide bar-rip morphology". At beaches without sandbars there were too few incidents in the heaviest surf to say anything; the authors write that their estimate there "does not provide reliable evidence that hazard is reduced or absent". Fewer rescues happen at the top level partly for a plainer reason. Fewer people go in.
Where the lifeguards disagreed
The forecast's other test ran forwards rather than back. Over one austral summer, between late September 2024 and early February 2025, lifeguards at 12 beaches graded the rip hazard in front of them on the same five-point scale, 568 times in all. Ten of the 12 were sandbar beaches, so this was a one-season check at a dozen sites and not a national one. The grades matched the algorithm exactly 53 percent of the time. In another 28 percent, the lifeguard put the hazard one level below the forecast.
The authors add those two groups together and present the sum as a floor rather than a score. They write that combining perfect agreement with the one-level-lower cases "provides a conservative measure of overall agreement", which comes to about 81 percent. Read the other way, the index leans toward overwarning, which is the direction a rescue service would choose. The disagreements that would worry a lifeguard run the other way, and they are rare. Among the ratings lifeguards themselves put at the top two levels, "17 % of the assessments rated at RI 4 or 5 by lifeguards were underestimated by 1–2 levels by the algorithm".
Not the first, and not yet live
None of this makes it New Zealand's first rip forecast, and the paper does not pretend otherwise. SwellMap, run by MetService's MetOcean Solutions division, already publishes potential rip hazard for named New Zealand beaches using the algorithm NOAA runs across most of the continental United States. What Stokes and his co-authors claim is narrower and carries their own hedge: to their knowledge, theirs "represents the longest running rip incident data set analysed, and most widely validated rip forecast in the literature to date".
The research was funded by Surf Life Saving New Zealand, which also supplied the logbooks, co-authored the paper, and will be the forecast's operator; the pilot work was paid for by Water Safety New Zealand and Auckland Council. The comparison against lifeguard judgment was run by that co-author, Albertoni de Miranda: the author contributions record that she "orchestrated and analysed the lifeguard perception data". The authors declare no competing interests, and the journal's review was independent: an editor and two anonymous referees. Code and data are only partly available on request, for privacy reasons, so neither headline figure can be recomputed from outside the project.
Surf Life Saving New Zealand is already running the algorithm internally, to warn its own managers of high-hazard days in time to change a roster. Publicly it is not live. The paper uses the present progressive: Surf Life Saving New Zealand "are now in the process of operationalising the NZ rip forecast algorithm nationally, on a public-facing web application". The intended home is Safeswim, which already carries the country's water-quality warnings. There is nothing for a swimmer to check yet.
When there is, one thing has to be read off the scale correctly. Two percent of the incidents in the archive happened at conditions the index scores one, its lowest setting, and the conclusions leave no room: "no conditions (with the exception of zero wave energy) should be considered completely free of rip risk for water users".