A Global Groundwater Model That Ships a Map of Where Not to Trust It

Ask a hydrologist how much water is under a given field in Mali, or under a village in Siberia, and the honest answer is usually a shrug. Groundwater is the largest store of liquid fresh water on Earth, and it is measured almost nowhere. Most of the world's groundwater records come from North America, Australia and Europe. Everywhere else is largely a guess.
That gap is what Barry van Jaarsveld, Marc Bierkens and colleagues at Utrecht University set out to fill. Writing in Earth System Dynamics, they report the first global simulation of groundwater at about a kilometer across and on a monthly step to cover both the past and the future. It gives the water table, the top of the water held in the ground, for every kilometer of land from 1960 to 2019, then projects it forward. The purpose is practical: people who have to keep water levels inside safe limits need numbers at a scale they can act on, and the global models available until now were too coarse to give them any.
The model itself is not new. GLOBGM was published at this resolution by Jarno Verkaik of Deltares and colleagues, several of whom are on this paper too. What is new is everything wrapped around it. The model was tuned against real wells, given a better way to handle wetlands and a better estimate of how much rain soaks down to refill the ground. It was then run out to 2100 under three combined emissions and social pathways, each with five climate models: SSP1-RCP2.6, SSP3-RCP7.0 and SSP5-RCP8.5, running from low to high emissions.
Testing a model of water nobody can see is the harder problem. The tuning used 34,800 monitoring wells, a set deliberately filtered to leave out known water-scarcity hotspots, because where a place is pumped hard you cannot separate the model's error from the farmer's pump. Those are the depletion regions the model is most often asked about, so the tuning number cannot be used to vouch for it there. Testing was a separate exercise, against how closely the model followed well records through time, and the machine-learning step that corrects its known offsets was trained on a larger set again, 96,799 wells.
The verdict that came back is honest and uneven. The model tracks shallow groundwater well and deep groundwater considerably less well: about 80% of wells in the top 20 meters were reproduced better than a do-nothing baseline, against 56% of wells more than 60 meters down. It also does better on the swing of the seasons than on change from one year to the next, which is awkward, because year-to-year change is what a long-term trend is made of.
The model comes with a map of its own blind spots
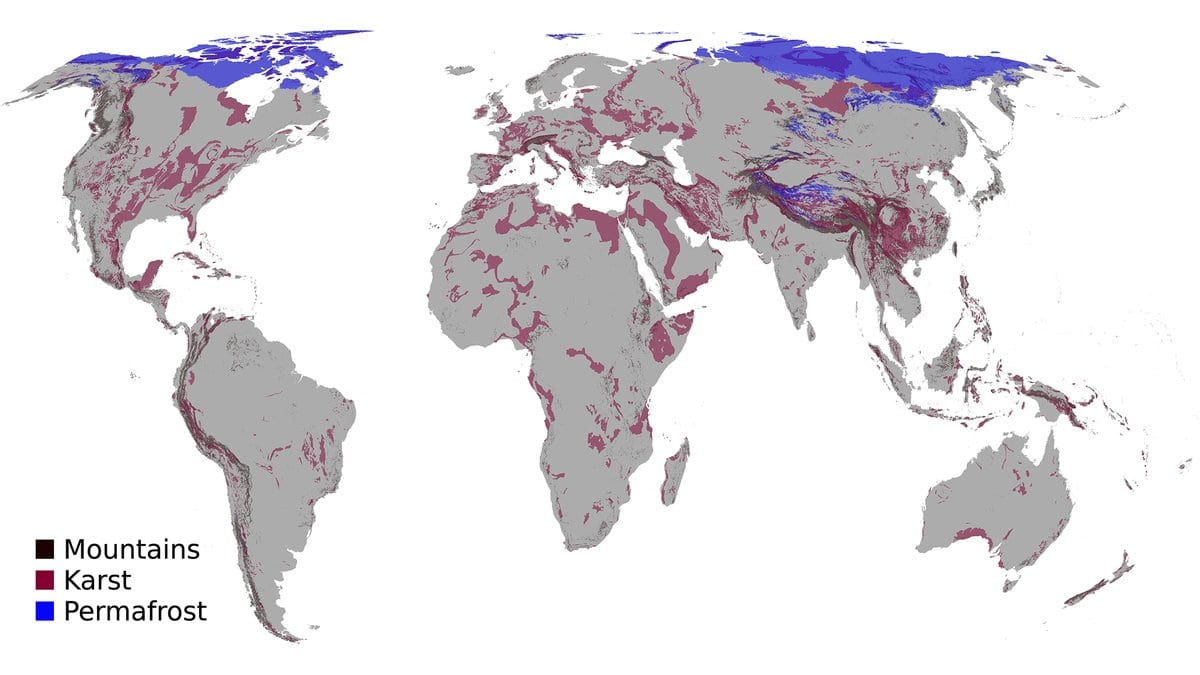
That candor is the paper's real contribution. Alongside the results the team publishes a map of the terrain the model was never built for. The flagged ground is karst, the cave-riddled limestone where water runs through channels instead of seeping; permafrost, ground that stays frozen year-round; and steep mountains. Quality flags ship with the public data, so anyone who pulls a number out of one of those regions is told so before they use it.
The team also checked the model against a pair of satellites that weigh the water in the ground from orbit. The two agree on the direction of change over most of the world's land and disagree outright over a small slice of it, and that disagreement is not scattered at random. It clusters over exactly the karst, permafrost and mountain terrain the map already flags.
The past run finds what was expected, and one thing that was not
Over the historical run, the model reproduces the groundwater losses hydrologists already know about: the U.S. High Plains, the Arabian Peninsula, the Indo-Gangetic Plain and Iran. That check holds up outside the model too. Jasechko and colleagues, writing in Nature, read the records of about 170,000 monitoring wells and found levels falling fast across dry regions with a lot of cropland, and falling faster than they used to in nearly a third of the world's big aquifers, the layers of rock and sand that hold usable water.
The model also finds water tables that have risen, most of them at high northern latitudes: northern Scandinavia, the Russian Far North. The authors are cautious about endorsing this finding. It could conceivably be climate change bringing more rain and more of it soaking down, they write, before noting in the same sentence that these trends fall in permafrost regions where their model has been shown to be less reliable. Several things sit behind that caution. The hydrological model GLOBGM draws its inputs from has no moving permafrost in it at all, and underestimates how much water soaks down as a result; the Arctic sits inside the paper's own unreliability map; and the satellites disagree with the model there on which way the water is going.
Which way the water goes next depends on the emissions path
Looking forward, water tables rise across most continents. Europe is the outlier, the one region where the water table clearly falls. But the scenario is doing much of that work: Europe's fall is most pronounced under the higher-emissions paths, and under the low one the continent stays roughly stable. Every change follows the same ordering: smallest under the low path, largest under the highest.
The Amazon and the Alps flip outright, the Amazon stable on the low path and falling on the higher ones, the Alps rising on the low path and falling on the higher ones. Over the United Kingdom the model shows no consistent signal at all. An independent projection published in Earth's Future (different climate models, and no human pumping in it) reached the same broad answer, more of the world's major groundwater basins rising than falling, and it too reported the split as a range that shifts with the scenario rather than a single number.
A rising water table is not the good news it sounds like, either. That same projection counts the people who would be pushed toward flooding by groundwater coming up, alongside the much larger number pushed toward shortage by it going down. Water arriving near the surface waterlogs fields, carries salt up with it and gets into foundations, cellars and buried pipe.
What the paper hands over is the dataset. The code is archived, the simulated water levels sit at permanent addresses on Utrecht University's data service, and everything is released under a license that lets anyone reuse it with credit. The quality flags come attached, so a water manager pulling a number out of northern Norway is told, before they use it, that the authors would not lean on it there.
Sources
- Earth System DynamicsPeer-reviewed
- doi.org
- doi.org
- doi.org