Heatwaves May Be Changing Shape, Not Just Getting Hotter

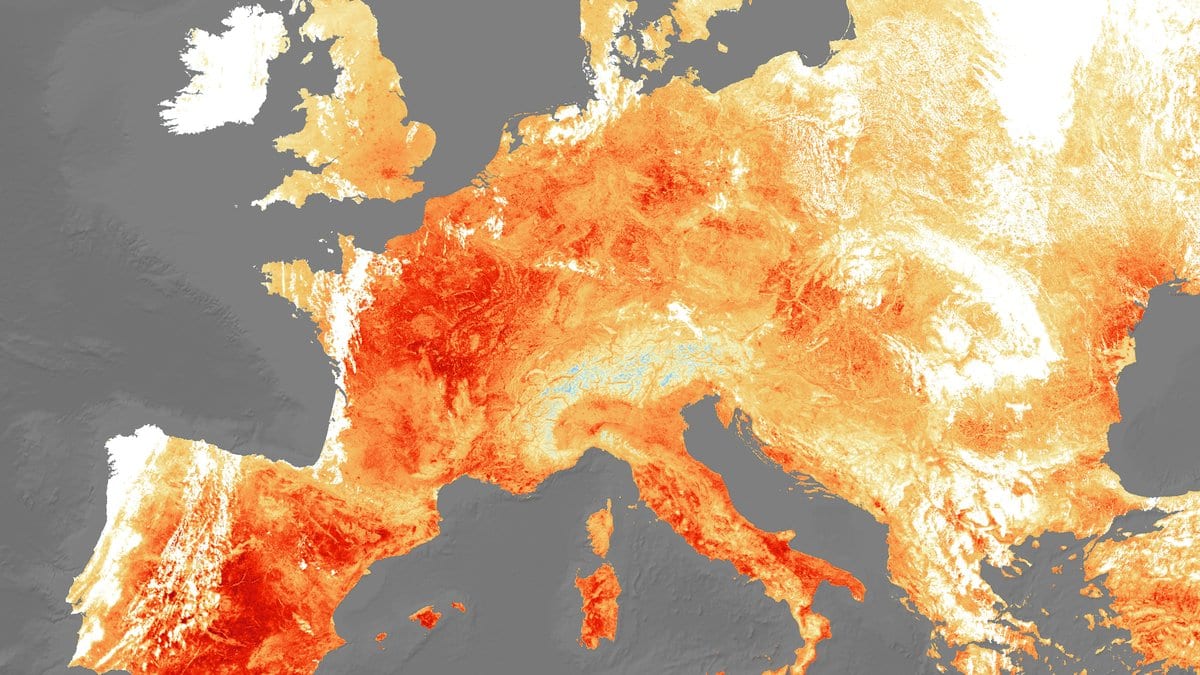
A heatwave is almost always reduced to a thermometer reading: a record broken, a threshold crossed, a number in the headline. But no single figure captures what a heatwave actually is: a whole configuration of the atmosphere, with high-pressure ridges parked overhead, winds redirected, cloud cover stripped away and heat funnelled up from the south. A team led by Aytaç Paçal at the German Aerospace Center (DLR), with colleagues at the University of Bremen and universities in Spain, set out to capture that fuller portrait, and to ask whether it has been quietly changing.
Their tool was a variational autoencoder, a type of neural network that learns to compress complex data into a compact summary and rebuild it. Fed enough examples, it discovers on its own which combinations of features tend to travel together. Here, that means which arrangements of pressure, wind, humidity and temperature make up a heatwave. The study, published on 13 July 2026 in Earth System Dynamics and peer-reviewed, applied that model to ERA5, the reanalysis dataset that stitches observations into a continuous physical record of the atmosphere back to 1940.
The setup was deliberately strict. Across the North Atlantic and Europe, the researchers pulled nine variables (among them near-surface temperature, winds, humidity, sea-level pressure and geopotential height) and built eleven-day snapshots centred on heat extremes. They trained the model only on heatwaves from 1941 to 1990, then turned it loose on the years 2001 to 2022, decades it had never seen. If it had truly learned the physics rather than memorising examples, it should recognise the newer events too.
It did. Without being told what a blocking high or an omega block was, the model sorted heatwaves into families that map onto atmospheric regimes meteorologists already know: the stagnant summer ridges that lock hot air in place, and the anticyclonic patterns behind warm winter spells. That the network rediscovered these on its own is a reassuring sign that it captured something real about the weather rather than statistical noise.
Then came the finding that gives the paper its edge. When the researchers plotted where recent heatwaves fell in the model's learned pattern space, the events of the last two decades clustered in their own distinct region, set apart from the historical ones. Part of that shift is exactly what you would expect from a warming world: hotter is hotter. So they went a step further and removed the linear warming trend, asking whether the newer heatwaves still stood apart once simple temperature rise was subtracted. They did. Statistically significant differences between the early and recent periods survived the detrending across all seasons.
That is the intriguing part, and it is where the authors are notably careful. The persistence of a gap after warming is stripped out points, they argue, to changes in the multivariate structure of these events (the way the atmospheric ingredients combine and evolve) rather than temperature alone. But they explicitly decline to call it a proven mechanism. In their own framing, the residual shifts should be read as evidence that the structure of heatwave-related conditions is evolving, not as a quantitative attribution to circulation dynamics. Linear detrending is a blunt instrument, and it cannot cleanly separate a genuine shift in weather patterns from the tangled, nonlinear ways warming can reshape the atmosphere. The result is a signal worth chasing, not a verdict.
It does not stand alone, either. Independent work has documented that Western European heat extremes have climbed faster than the mid-latitude average (faster, in fact, than warming alone would predict), with trends in atmospheric circulation, such as more persistent high-pressure blocking, offered as part of the explanation. This study adds a fresh, data-driven line of evidence pointing the same way, from a method that let the patterns speak for themselves rather than imposing a definition up front.
The practical stakes sit in that gap between a number and a pattern. If heatwaves are only getting hotter, a single shifting threshold captures the risk. If their underlying structure is also changing (as this analysis suggests, with due caution, that it may be), then models tuned to the past could misjudge how the most dangerous events unfold. Reading the full shape of a heatwave, not just its peak, may be part of seeing what is coming.
Sources
- Earth System DynamicsPeer-reviewed