In a Model, Europe's Coast Takes in Carbon All Year Round
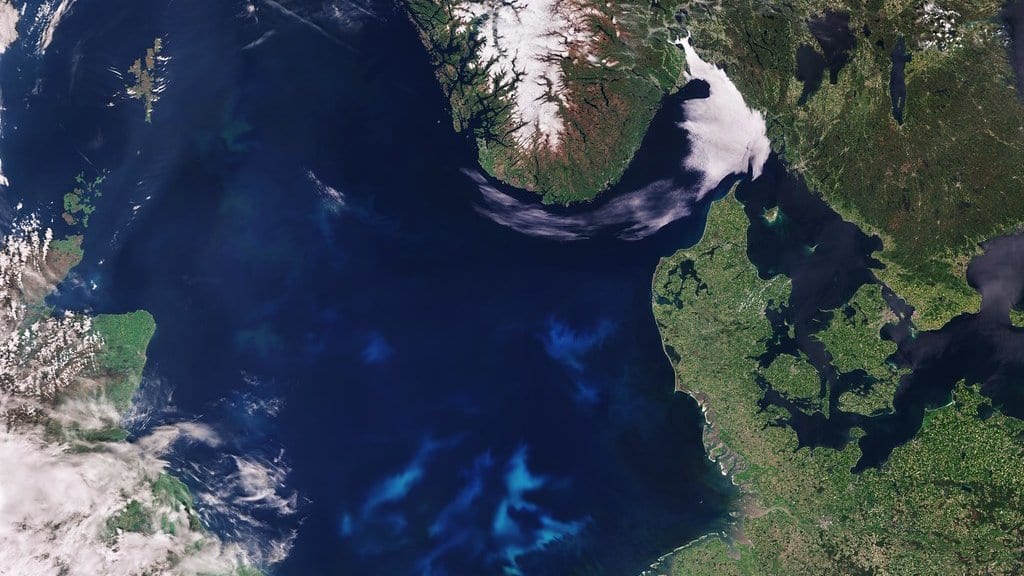
Europe's continental shelf already breathes in two ways, and the dividing line sits near 60 degrees north. South of it, temperature sets the rhythm: cold winter water dissolves carbon dioxide easily and draws it in, while warm summer water holds less and lets some of it go. Farther north, life sets the rhythm instead, and the shelf gives carbon back through the dark months and takes it in once the spring bloom begins. Any plan to make this coastline absorb more carbon has to work on top of that split.
One idea for doing that is ocean alkalinity enhancement: adding alkaline material to seawater so that dissolved carbon dioxide is converted into bicarbonate, the stable form carbon takes in the sea. The pressure of carbon dioxide in the water falls, and more of it moves in from the air to restore the balance. Nobody has done this along a coastline. What exists is simulations.
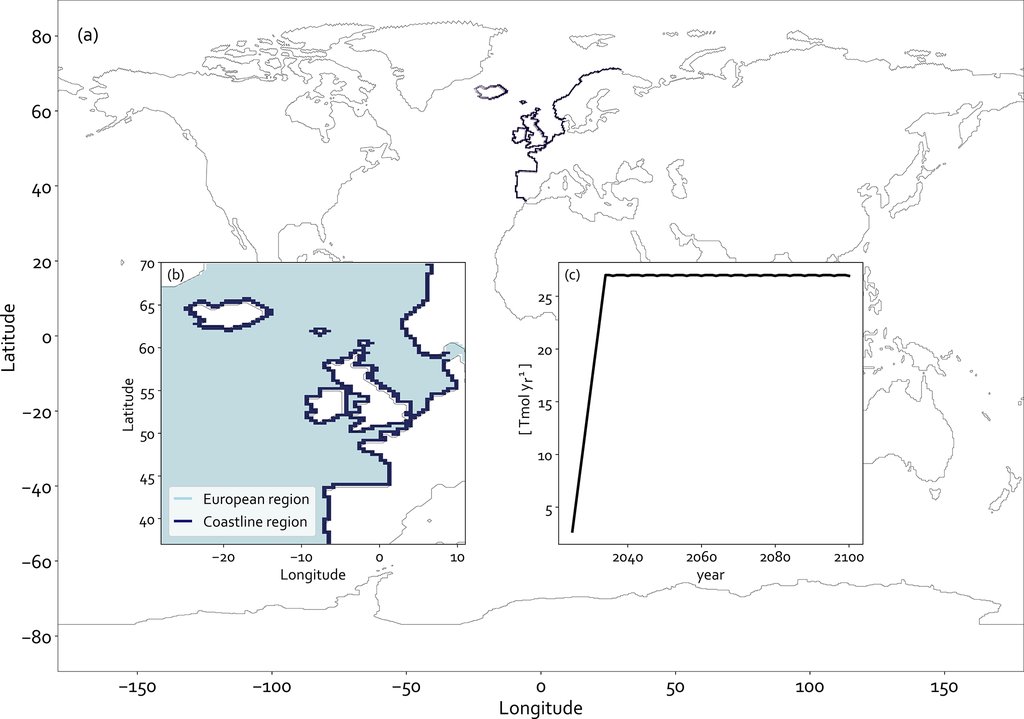
One of them was published Oct. 7, 2026, in Earth System Dynamics. Chiara Ciscato of the CMCC Foundation in Bologna and GEOMAR in Kiel, with four colleagues, worked through Earth system model runs in which alkalinity is poured continuously into a narrow band of Europe's coastal water from 2025 to 2100. The band is a few tens of kilometers wide and only about 3 meters deep, and it leaves out the Mediterranean and the Baltic. The amount rises over its first decade to the equivalent of 1 billion metric tons of fast-reacting calcium hydroxide a year, then holds there. Every figure below is an average for the 2090s. The authors are plain about what this is: the design, they write, "mimics an idealised application, which is unlikely to become a real-world case."
Summer keeps the chemistry near the surface
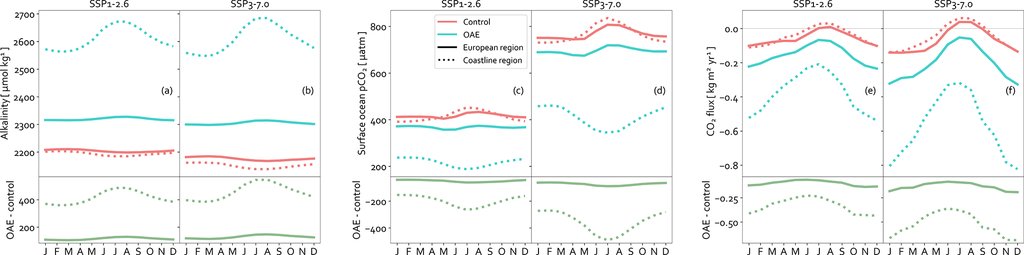
In these waters, surface alkalinity naturally peaks in winter, when mixing stirs up water from below, and dips in summer. Adding it at the surface turns that cycle upside down. In summer the upper ocean is warm and layered, the mixed layer is shallow, and what is added stays roughly where it was put. In winter it is diluted and carried down. Along the coastal strip, summer surface alkalinity ends up more than 500 micromoles per kilogram above the run without any addition, on water that naturally carries about 2,200.
That figure is also the paper's own warning. The authors write that alkalinity on that scale could exceed "critical thresholds for parameters such as pH and aragonite saturation state, thereby adversely affecting local biota." Aragonite saturation measures how easily shells and skeletons form. The retention that makes the method work in the model is the same thing pushing the chemistry toward those limits.
The carbon still moves on winter's schedule
The drop in carbon dioxide pressure is largest in summer, exactly when this shelf would otherwise be giving carbon back. In the model it is large enough to cancel that: summer outgassing becomes net uptake, and the region draws carbon in during every month of the year.
The carbon itself, though, keeps a different diary. The largest increase in carbon dioxide actually crossing the sea surface arrives in winter. That exchange stays in step with the mixed layer, which is deep and well stirred in the cold months and shallow in the warm ones, whatever the alkalinity is doing. Under the low-emission pathway the European region's winter uptake more than doubles.
That winter peak belongs to this design rather than to the method. The authors note that their own seasonal pattern appears to contradict simulations that added alkalinity in pulses, or over a few months, and found summer the more efficient season. Topping the surface up continuously for decades is a different experiment.
The high-emission run is the one that looks better
The result most open to being read backwards is the comparison between futures. The modeled sink grows more under the high-emission pathway than under the low one. The reason is not that a warmer ocean takes up more carbon in general.
The same quantity of alkalinity goes in under both, and surface alkalinity ends up at similar levels in both. What differs is the water receiving it. The high-emission ocean already holds more dissolved carbon. That lowers its buffering capacity, meaning it resists the chemical change less, so the same addition pushes the carbon dioxide pressure down further. The pressure gap between water and air is wider as well. Two effects pulling the same way: winter uptake under the high-emission run reaches 0.327 kilograms per square meter per year, against 0.235 under the low one.
None of that makes a high-emission world a better place to try this. Jörg Schwinger and colleagues reported in Environmental Research Letters in 2024 that the chemical efficiency of alkalinity addition rises by about 18% when atmospheric carbon dioxide doubles from preindustrial levels, and by 29% when it quadruples. They also found that "both effects are reversed" if atmospheric carbon dioxide later declines. The advantage is borrowed, and it is handed back once emissions fall. Ciscato and colleagues add a second counterweight: higher carbon dioxide also warms the surface and strengthens the layering, which keeps carbon from being carried down into deeper water, and depth is where long-term storage happens.
Hard to count, if anyone ever tried it
The paper offers one practical handle. Because adding alkalinity at the surface reverses the seasonal cycle, that reversal could itself be a signal monitoring programs look for, a way of checking that the material is where it is meant to be.
The accounting is harder. In these runs the extra uptake spreads well beyond the band where alkalinity goes in, and the authors cite earlier modeling that put about half of the carbon drawn down by coastal alkalinity addition worldwide outside the injection sites altogether. Measurement confined to national waters would therefore undercount what a deployment had actually removed.
The paper sets out its own limits: the model resolves coastal waters poorly, alkalinity carried in by rivers is left out, and the conclusions rest on differences between runs rather than absolute values. The data and the analysis notebooks are openly posted, so another group can check them. David P. Keller, who supervised the work at GEOMAR, has since moved to the Carbon to Sea Initiative in Washington; the funding is German and European public money, and the authors declare no competing interests. Their closing recommendation is not to scale this up but to test pulsed and point-source coastal experiments first.